


Survey of Bank Forecasts – August
by David Hogan
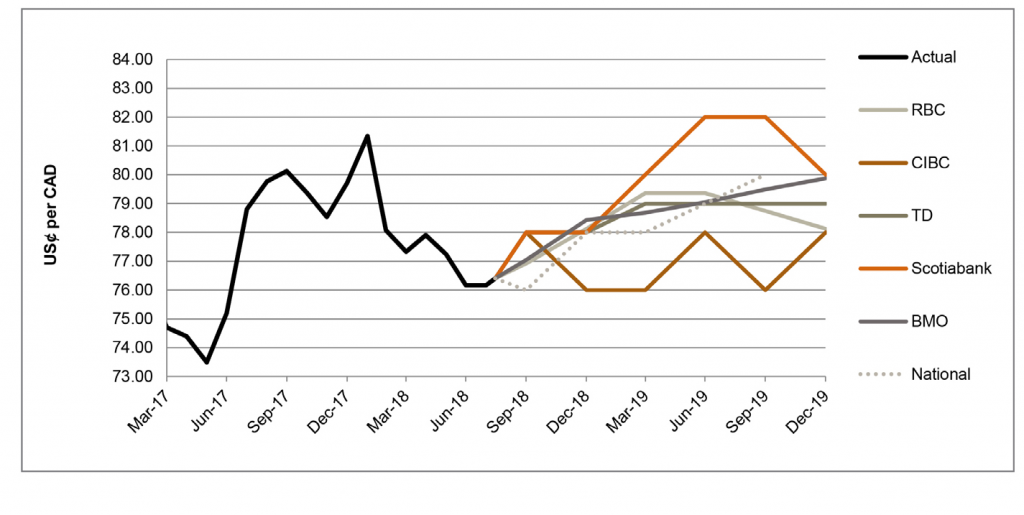
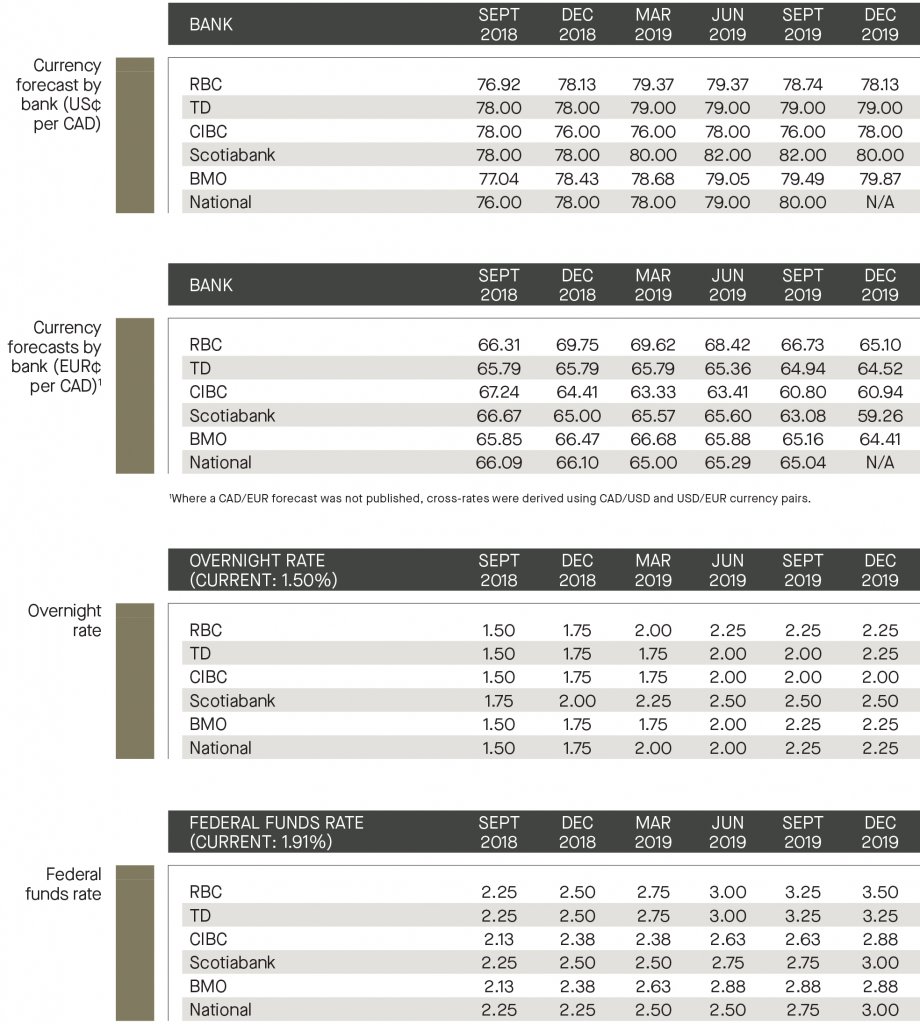
CAD proves resilient amongst trade uncertainty
Despite trade and geopolitical tensions, the GDP in both Canada and the U.S. experienced strong growth. RBC noted that U.S. Q2 GDP growth increased to 4%, the highest quarterly rate since 2014, whilst Canada’s economy in Q2 appears to have doubled its Q1 pace. It is important to note that exports were a major contributor to the GDP growth in Canada, however with many tariffs and counter-tariffs implemented in June and July, these tailwinds are unlikely to be sustained. As anticipated in its July press conference, the Bank of Canada (“BoC”) raised its benchmark interest rate from 1.25% to 1.50%, which has helped support the Loonie. Over the last month, the CAD has shown some improvement in comparison to its previous summer lows, trading at 76.4 USȼ/CAD as of the date of publication.
According to TD, the CAD is currently 4% undervalued as a result of the uncertainty over trade. National shares TD’s thoughts, adding that until trade tensions calm down, it is unlikely that the Loonie will appreciate in a significant way. TD adds that the BoC is still faced with a closed output gap and inflation is at the target rate, therefore it is expecting the BoC to raise the interest rate again in October. Uncertainties will continue to cloud the USD/CAD forecast until some negotiations are reached, particularly the ongoing dispute with the NAFTA agreement which could have significant implications on the currency pair. Overall, the surveyed banks are in consensus that the pair will trade between 76.0 and 82.0 USȼ/CAD by the end of 2019.
ECB strikes a dovish tone, signals further stimulus
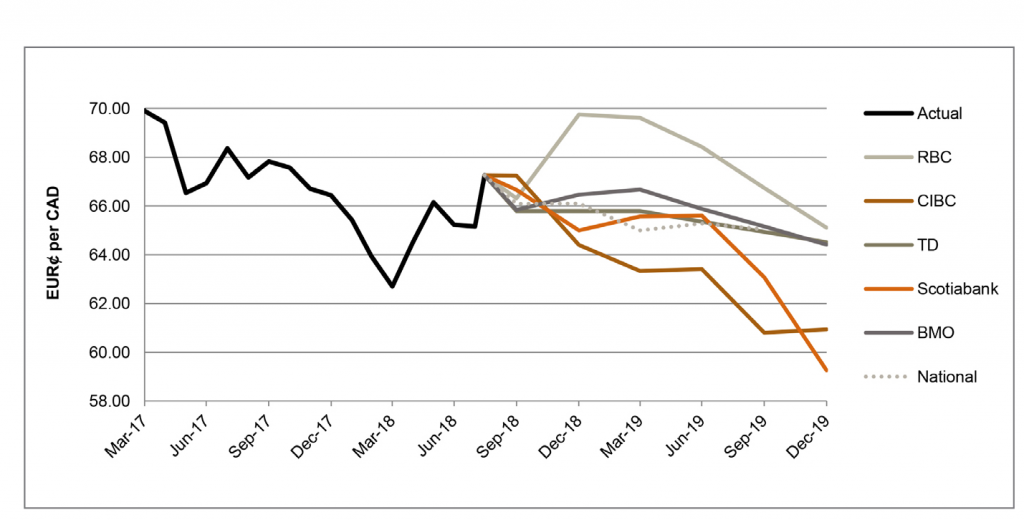
On July 26, the European Central Bank (“ECB”) held its July press conference indicating that the benchmark interest rate will remain at their present levels at least through the summer of 2019. In the announcement, the ECB made it clear that “significant monetary policy stimulus is still needed … over the medium term.” The ECB will continue their asset purchases until the end of 2018, and then plan on reinvesting the principal payments from maturing securities for an extended, but undisclosed period of time.
RBC described the ECB meeting as “one of the most uneventful in recent memory as the path of monetary policy has largely been laid out for the next year.”[1] The loose monetary policy by the ECB is anticipated to weigh on the EUR. National highlights that speculators seem to be losing faith in the common currency based on their swindling long positions, adding however there will come a point when the Fed normalization ends and that should help in the appreciation of the EUR. Overall, the forecast by the surveyed bank remains unchanged for the EURȼ/CAD since last month’s publication, anticipating the currency pair to trade between 59.3 and 69.8 EURȼ/CAD by the end of 2019.
Fed and BoC scheduled for fall hike
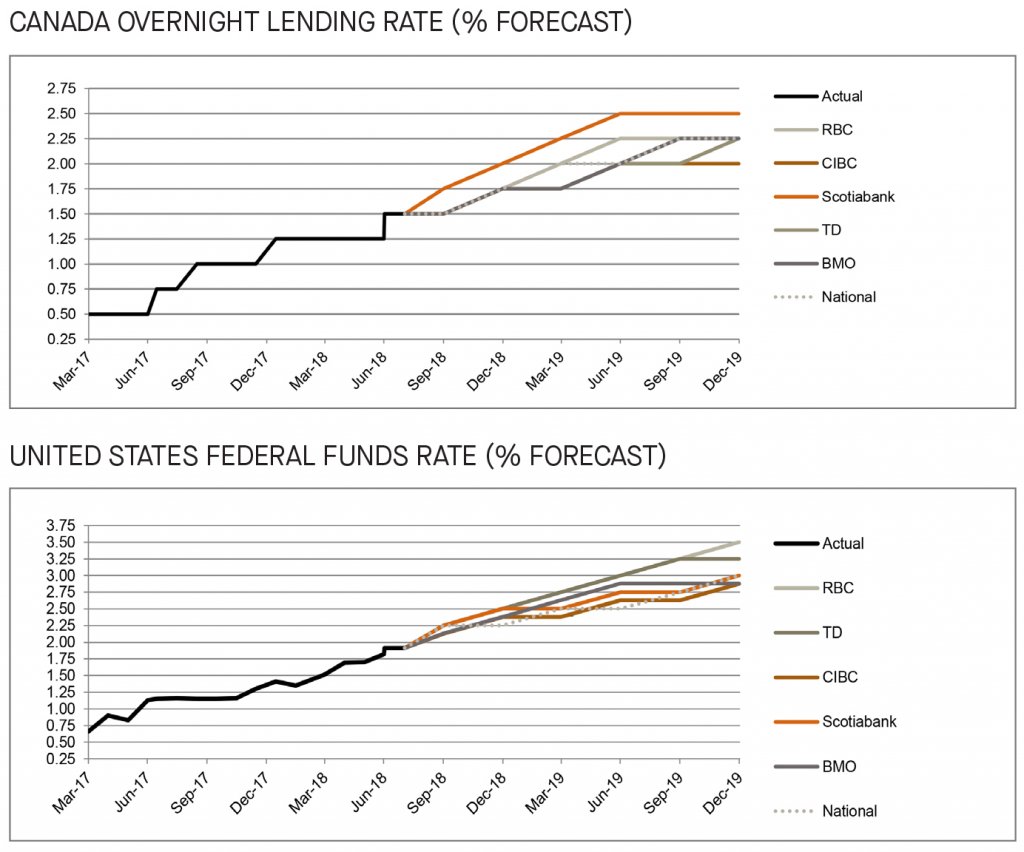
As noted above, the BoC followed through with its predicted interest rate hike in July. The current rise in inflation and GDP growth support the call of many of the surveyed banks that another rate hike is soon likely. RBC believes there will be a measured approach to monetary tightening, which will result in a rate hike in October. Scotiabank is anticipating a September rate hike, and BMO is not fully ruling out a hike in September if the economic conditions allow for it. Overall, the majority of the surveyed banks are in consensus that the BoC will deliver one interest rate hike this fall.
For the U.S. Federal Funds Rate, it has been a somewhat of an uneventful summer. RBC reported that the Fed’s latest meeting minutes suggest that rates remained on target and there would be only small adjustments to the future policy statement reflecting the latest data. However, those minor adjustments had a hawkish undertone. BMO highlighted that a September rate hike, if followed through, will raise the interest rate up to 2.0% or 2.25%, which would notably be above inflation for the first time since March 2008. BMO added that starting 2018Q4, the FOMC will become more cautious, raising the risk of a pause or, more generally, a shift out of a quarterly rate-hike pattern. Overall the banks are in consensus that the Fed will raise its target rate in September.
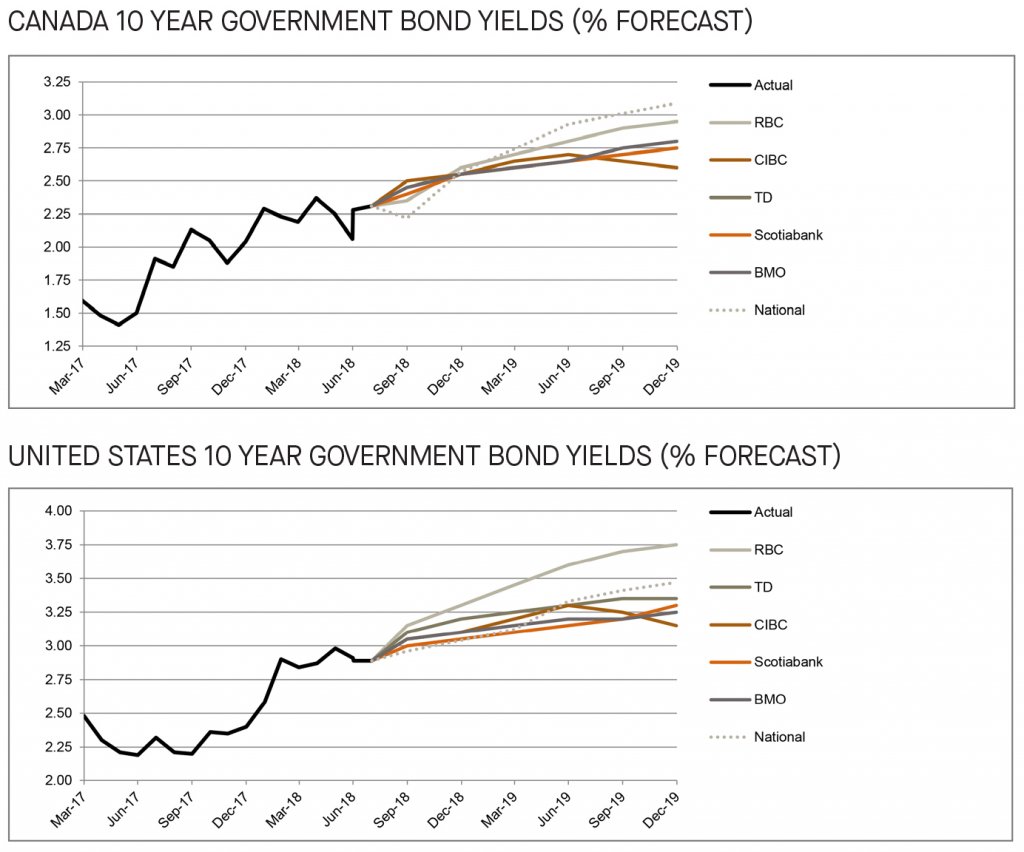
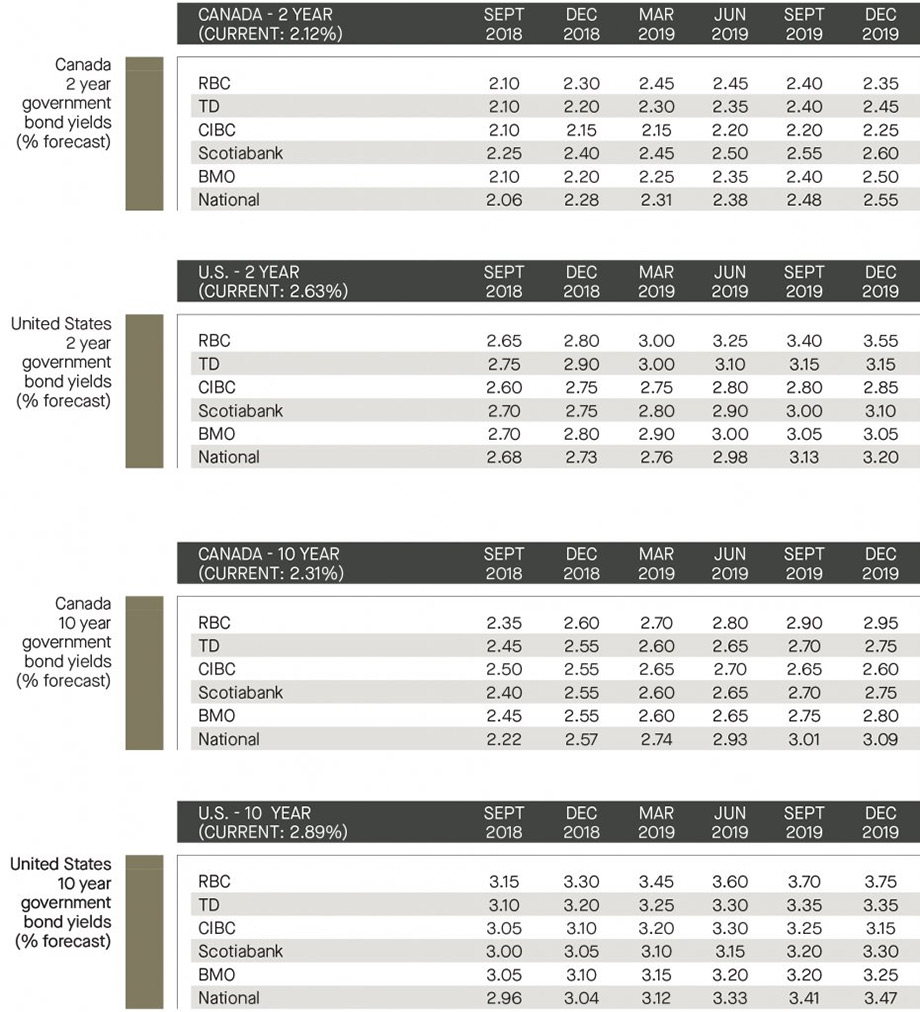
Rising Canada and U.S. short term bond yields
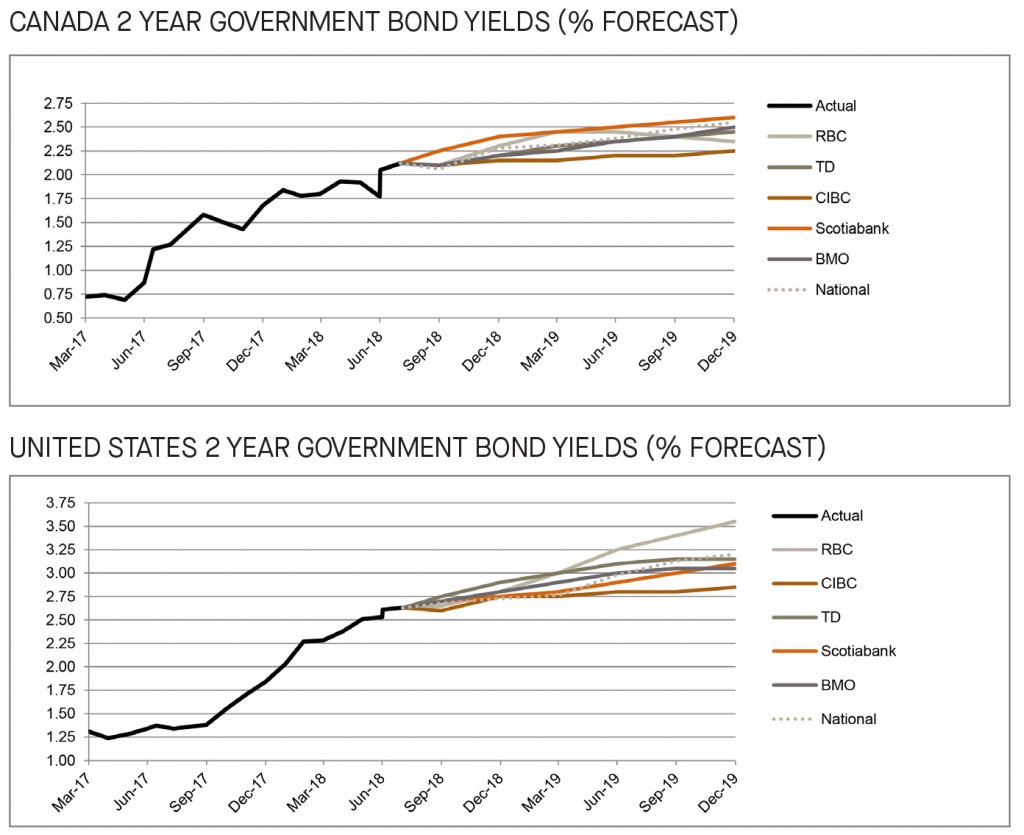
Most of the surveyed banks have made upward adjustments to the Canadian 2 year bond yield forecasts for the remainder of 2018 and into 2019. Conversely, only BMO has made upward adjustments to the 2 year government bond yield forecast in the U.S. for the same period. Overall, the surveyed banks are in consensus that the short term bond yields will continue to gradually rise, consistent with the BoC and Fed rate hikes in October and September, respectively.
Risk of inverted Treasury yield curve on the rise, a recession indicator
The forecasts for Canadian and U.S. 10 year government bonds have remained stable. TD and BMO highlighted that the likelihood of an inverted yield curve, where the 2 year yield is higher than the 10 year yield, is on the rise. This development is notable as historically inverted yield curves have preceded recessions. Overall, the 10 year government bonds are expected to yield between 2.6% and 3.1% in Canada, and 3.2% and 3.8% in the United States by the end of 2019.
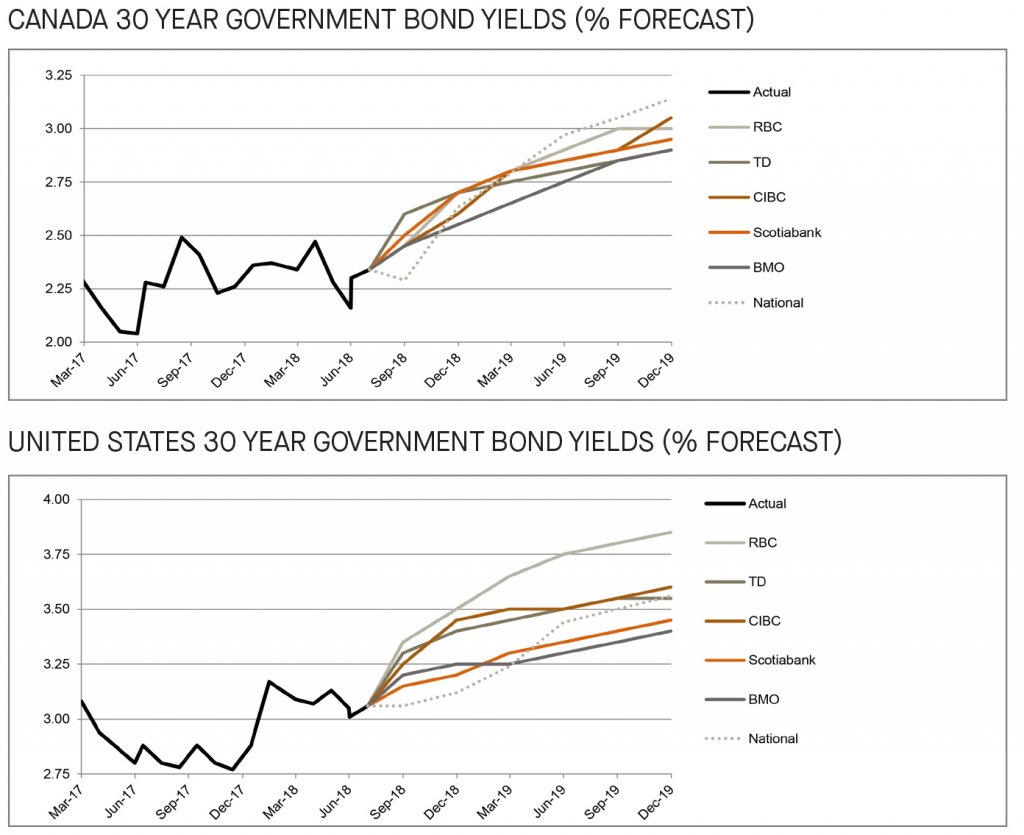
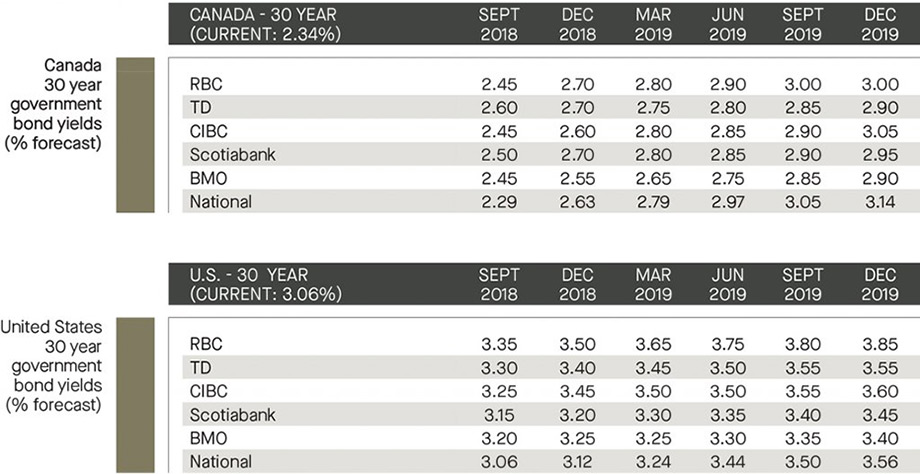
Long bond yields to rise through 2019
Compared to last month, there were no major changes in the forecasts for the long term government yields in both the U.S. and Canada. BMO is the sole surveyed bank that downwardly adjusted the U.S. long term forecast for the long bond yields, citing low jobless rates and stubborn inflation. Although no change in the forecast, TD highlighted that the U.S. long term bond yields are doing a decent job of pricing the Fed path. Overall and consistent with last month’s July publication, forecast of an upward trend for both the Canadian and U.S. long bond yields remains consistent through 2019.
[1] http://www.rbc.com/economics/economic-reports/pdf/financial-markets/fmm-August2018.pdf