


Survey of Bank Forecasts – July
by David Hogan
BoC raises overnight rate despite well-documented trade policy uncertainty
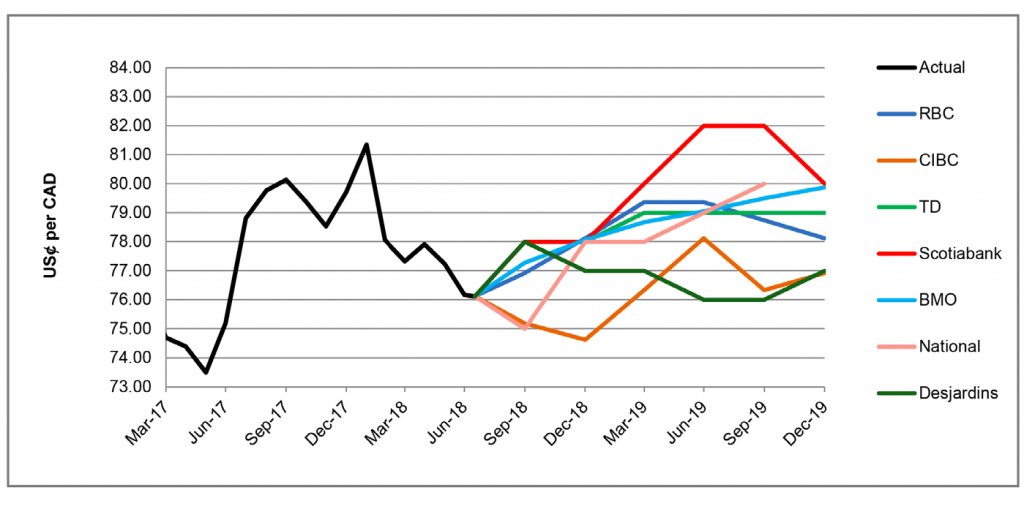
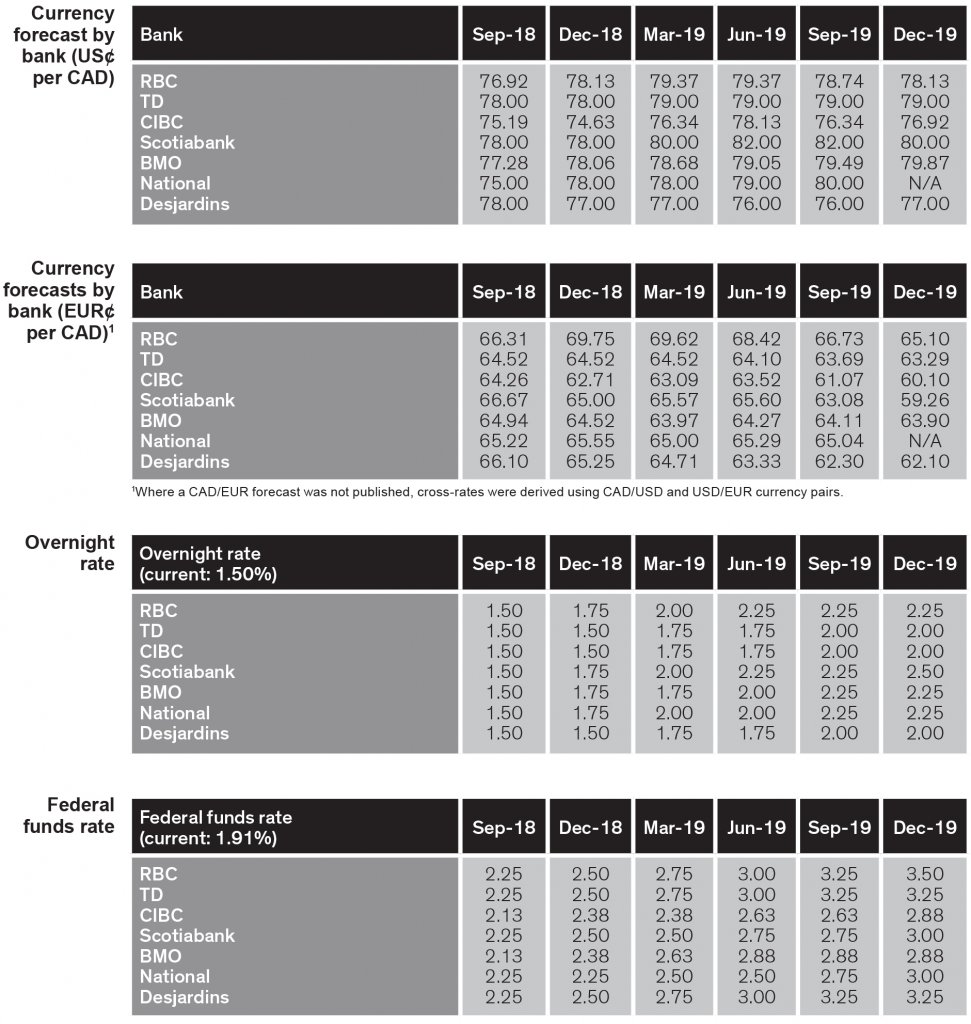
Despite the ongoing trade tensions, the Bank of Canada (“BoC”) raised its benchmark interest rate by 25 basis points on July 11 to 1.5%. BoC Governor, Stephen Poloz, highlighted in the press conference that “inflation is on target and the economy is operating close to capacity.”[1] The raise struck an upbeat tone for Canada as it now expects a growth rate of 2% over the next couple of years, as reported by Desjardins. National struck a more cautionary note, adding that the resolution of NAFTA negotiations by the end of 2018 seems unlikely between Canada and the U.S. given the tariffs imposed on steel and aluminum imports and the auto sector. National also highlighted that the Greenback has gained strength over the Loonie due to tighter Fed policy and will likely continue to do so over the next month. The CAD has slightly recovered from its year low last month and as at the date of publication, traded at 76.1 USȼ/CAD. Overall, the surveyed banks are in forecast consensus, expecting the currency pair to trade above 74.6 and below 82.0 USȼ/CAD through to the end of 2019.
ECB policy rates unchanged, EUR/CAD remains stable
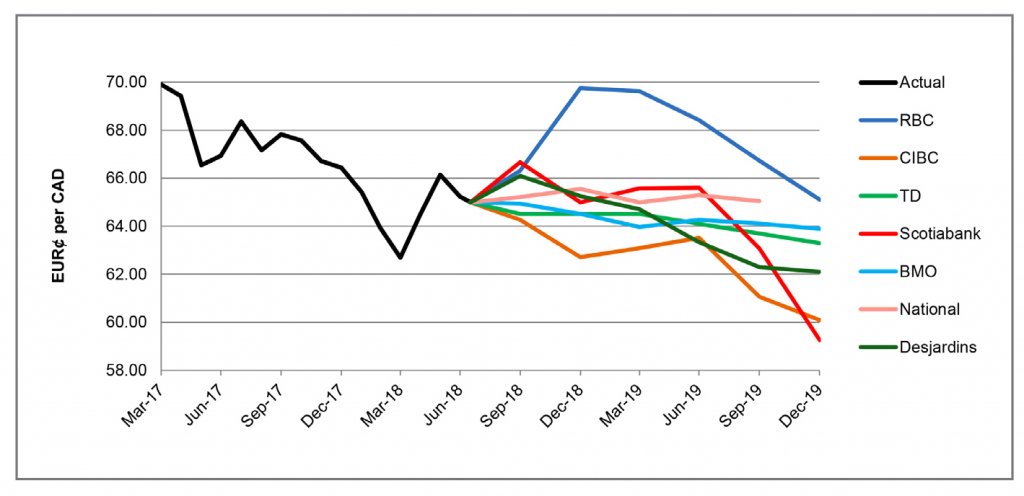
As of July 16, the EURȼ/CAD traded at 65.0, relatively in line to valuations observed in last month’s publication. Despite the shortage of volatility, some headline risks currently loom over the Eurozone. Notably, BMO highlighted that concerns over global trade policy have led the European Central Bank (“ECB”) to announce its intent to leave the benchmark interest rate unchanged until September 2019. BMO also reiterated ECB President Draghi’s concerns regarding international trade wars in which the central banker stated “it’s very worrisome and again, I can’t see any positives.”[2] The surveyed banks are in consensus that the ECB will not adjust its policy rates until at least September 2019. Overall, the surveyed banks forecast that the EURȼ/CAD pair will trade between 59.3 and 69.8 through to the end of 2019.
BoC to deliver additional hike this year; Fed to deliver two
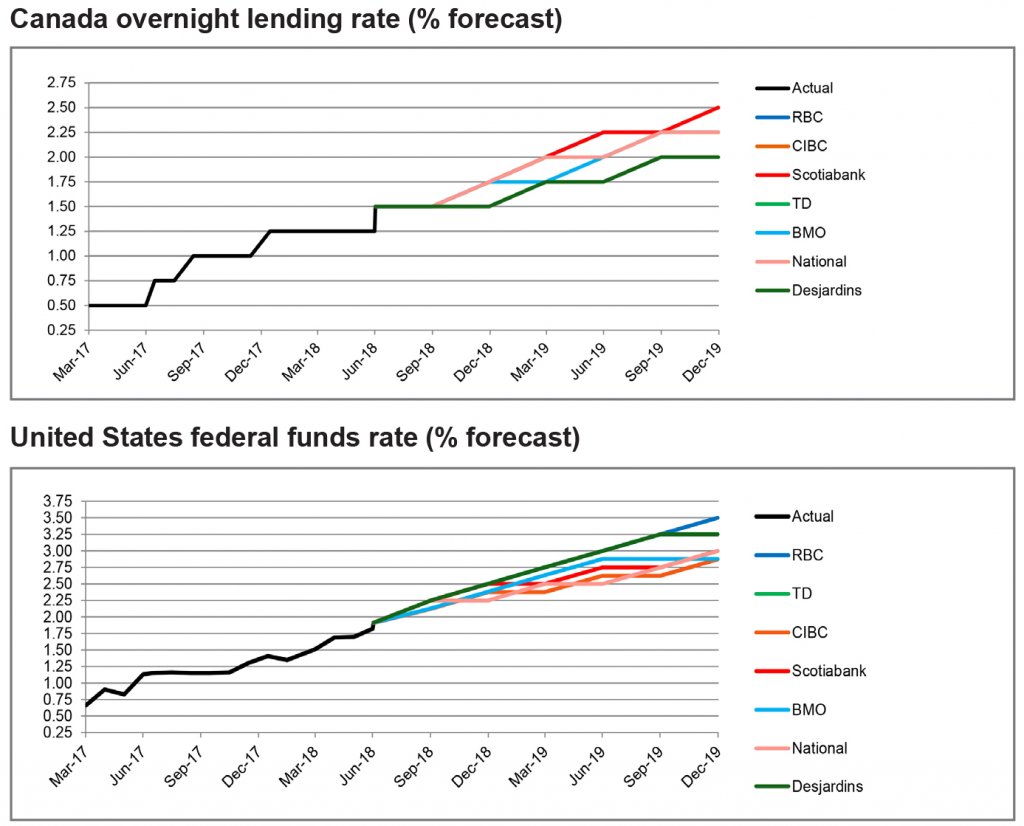
On July 11 the BoC increased its overnight rate from 1.25% to 1.50%. RBC highlighted that the BoC “raised rates as expected in July and didn’t sound all that dovish in the face of growing trade threats.”[3] It has been six months since the last raise on January 17, 2018 and the first time the overnight rate has been at least 1.50 per cent since December 2008. Most of the surveyed banks had predicted the raise except for National Bank, which expected it to occur in the third quarter of 2018. Despite growing trade tensions, the banks are in consensus in expecting the BoC to deliver an additional hike by the end of 2018.
National noted that the “U.S. economy appears to have enough momentum to breast the FOMC’s gradual normalization“[4] and expects the next rate hike announcement at the September meeting, with an additional hike by year end. Similarly, Desjardins anticipates that the following quarter hikes will provide for a faster monetary tightening environment in the United States. Overall, the surveyed banks are in consensus that the Fed will deliver two more rate hikes this year (in Q3 and Q4).
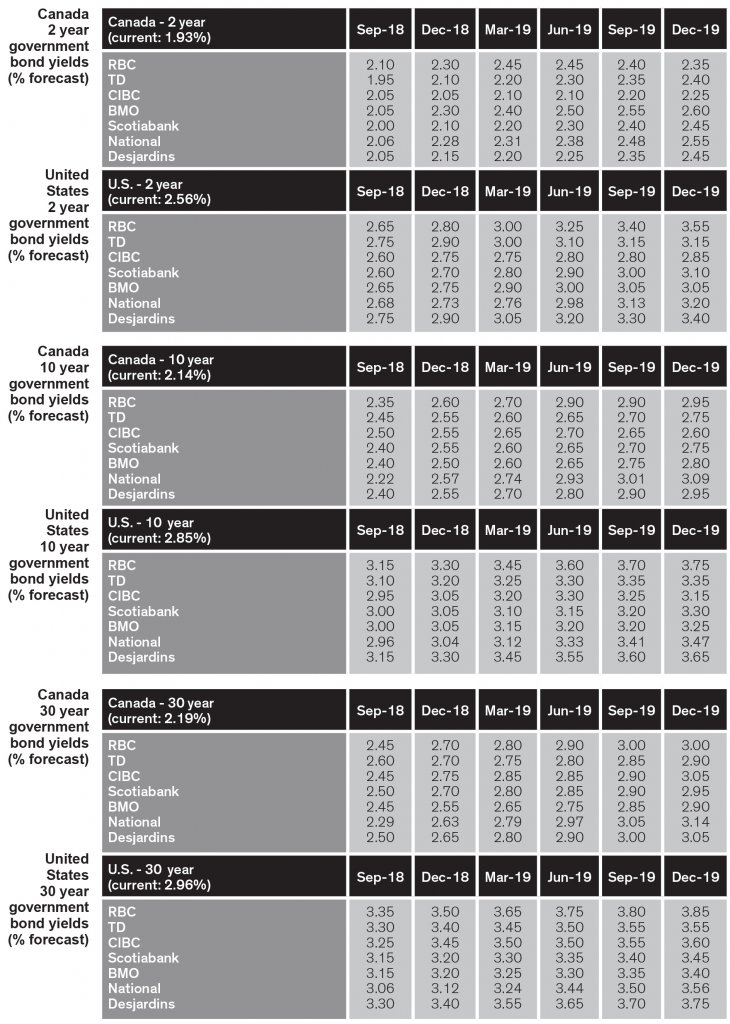
2 year bond yields rise in the U.S. amidst trade spat
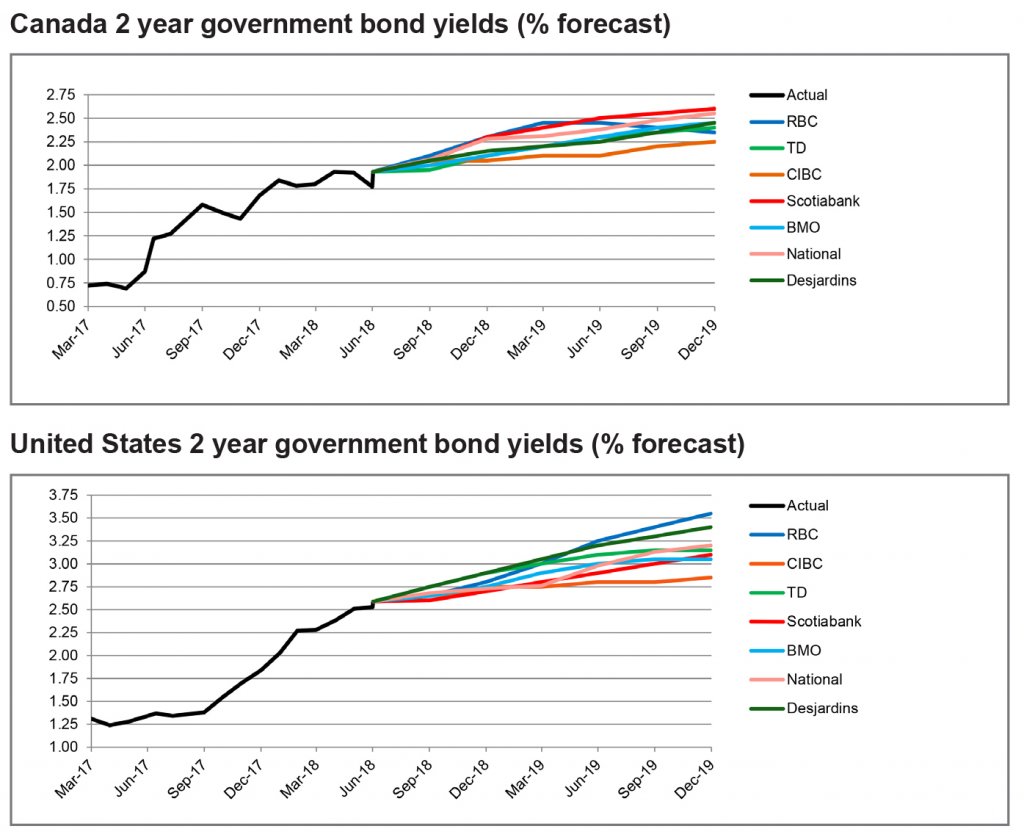
As at the date of publication, the 2 year government bond yielded 1.9% in Canada and 2.6% in the United States. The surveyed banks reported downward adjustments for the 2 year Canada government bond and minor upward adjustments in the U.S. since last month’s publication. The decrease in Canadian yields may be in part attributable to the geopolitical risks surrounding Canada as noted by Desjardins, whereas tighter Fed monetary policy as a result of a strengthening economy have influenced the increase in U.S. treasury yields. The 2 year government bonds are predicted to yield between 2.3% and 2.6% in Canada, and the U.S. is forecasted to be between 2.9% and 3.6% by the end of 2019, indicating an expectation for a rising yield environment over the next 18 months.
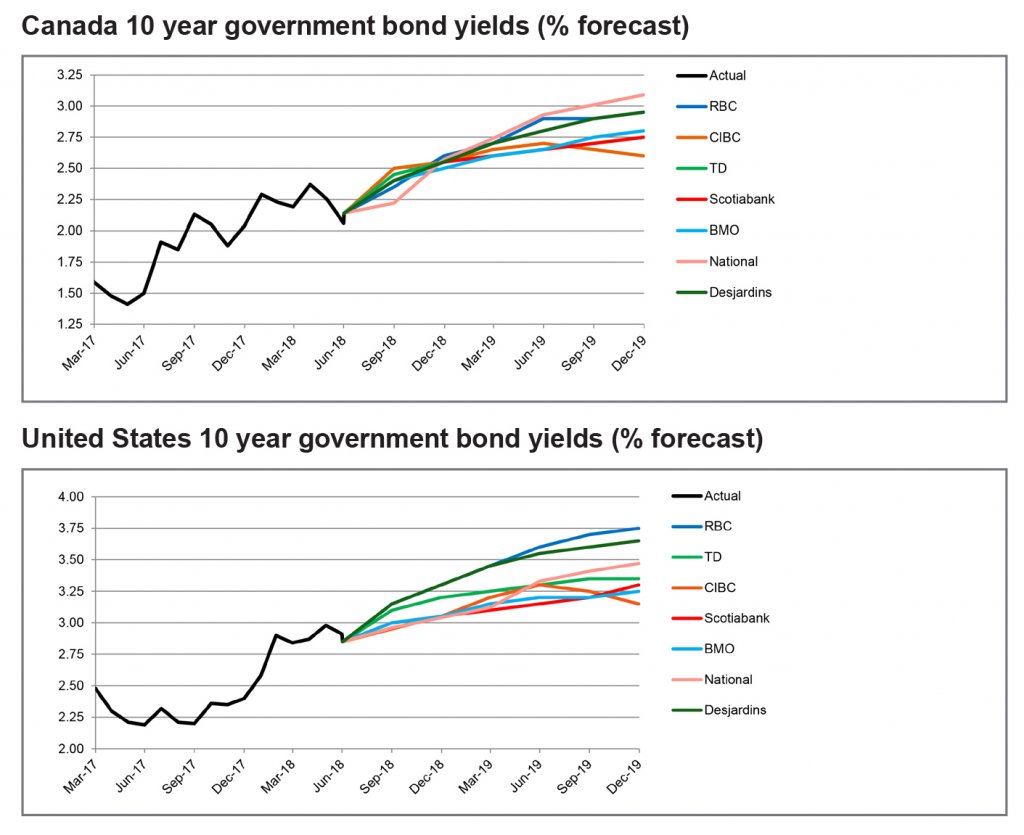
10 year yield forecasts adjusted downward, to rise through 2019
The 10 year government bonds yielded 2.1% in Canada and 2.9% in the U.S. as of mid-July respectively. Compared to last month’s publication, the surveyed banks made minor downward adjustments to the 10 year government bond yields for both Canada and the United States. RBC highlighted that decreasing long term U.S. treasury yields reflect “safe haven flows amid rising trade risks rather than shifting expectations for monetary policy.”[5] Overall, the surveyed banks are forecasting that through 2019, the 10 year government bond yields will rise to between 2.6% and 3.1% in Canada and 3.2% and 3.8% in the United States.
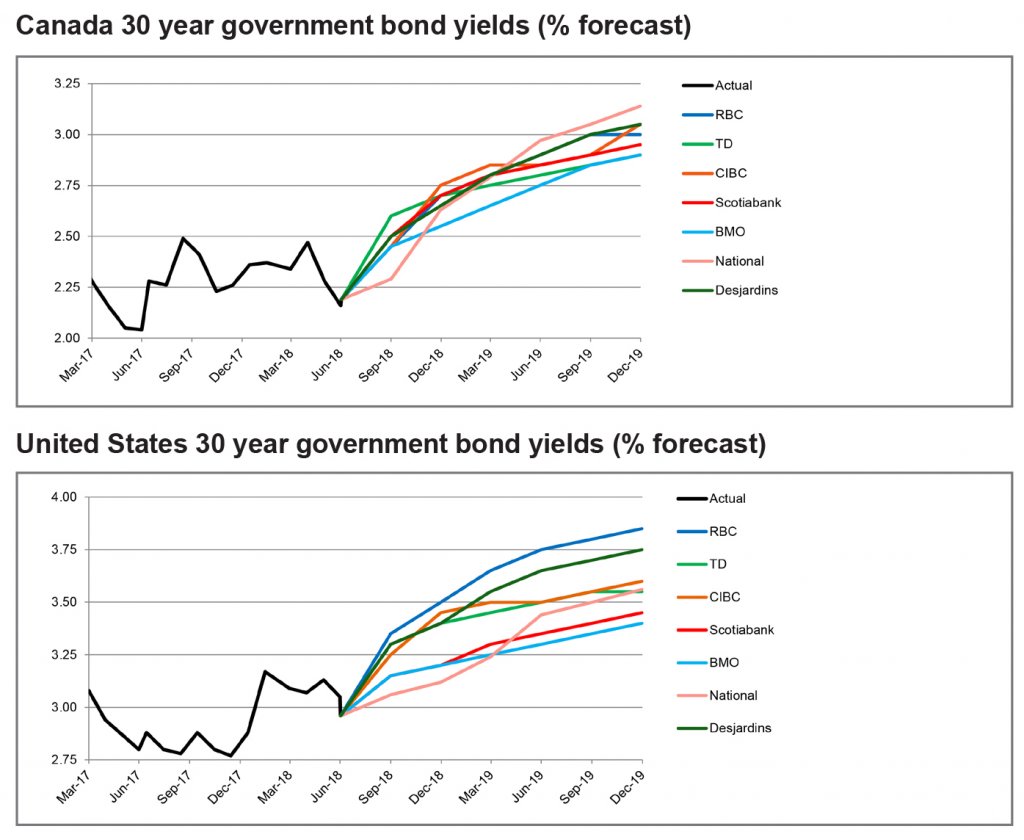
Long bond yields to rise over next 18 months
Consistent with the 10 year government bond yield forecasts, we observe minor downward adjustments to the forecasts for the 30 year government bonds yields in the U.S. and Canada. Trade uncertainties and geopolitical risks are amongst the headline risks spooking investors, resulting in safe haven flows into longer term bonds which are pushing down yields. RBC notes that trade risks will likely continue to impact bonds for the rest of the year, but continue to expect long bond yields to rise over the next 18 months. Overall, the surveyed banks are forecasting the long bond yields to reach between 2.9% and 3.1% in Canada and 3.4% and 3.9% in the U.S. by the end of 2019, well above current levels.
[1] https://www.bankofcanada.ca/2018/07/opening-statement-110718/
[2] https://nesbittburns.bmo.com/getimage.asp?content_id=63277
[3] http://www.rbc.com/economics/economic-reports/pdf/financial-markets/fmm-July2018.pdf
[4] https://www.nbc.ca/content/dam/bnc/en/rates-and-analysis/economic-analysis/monthly-fixed-income-monitor.pdf
[5] http://www.rbc.com/economics/economic-reports/pdf/financial-markets/fmm-July2018.pdf