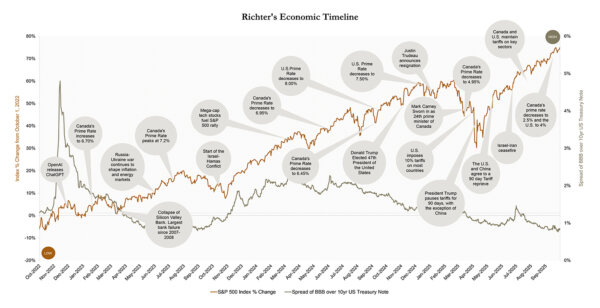
The Richter Economic Timeline: What was known or knowable and what did the market say?

The Richter Economic Timeline
Sources: Available upon request
Richter’s economic timeline plots local and world events together with a depiction of the volatility of the stock market (S&P 500) and credit markets (the spread of publicly traded BBB corporate bonds over U.S. treasury notes).
After the sharp Q1 2025 market decline and a strong rebound in Q2 resulting from changing trade related sentiments, U.S. equities continued their ascent in Q3. The S&P 500 rose 8.1% reaching new highs. The rally was fueled by a late‑September rate cut by the Federal Reserve, strong earnings (especially among tech/AI names), and easing trade‑tensions. Equity markets and bond yields are likely to experience heightened volatility in Q4 2025, as investors react to changing macroeconomic signals including inflationary pressure and trade. This occurs contemporaneously with the following:
- Both the U.S. Federal Reserve and the Bank of Canada shifted to easing in September, each cutting rates by 25 bps after holding steady in previous quarters. These moves reflected mounting growth concerns tied to tariffs, cooling labor markets, and persistent inflationary risks, signaling a more accommodative stance heading into year-end.
- In September, Canada’s unemployment rate remained at 7.1%, the highest since the pandemic. Meanwhile, the U.S. unemployment rate held steady at approximately 4.3% throughout Q3.
- Canada’s housing market remained weak in Q3, with resales down 3.4% year-over-year. Affordability improved slightly following the Bank of Canada’s 25 bps rate cut to 2.50%.
- Following the June summit Canadian pledge to raise defense spending to 5% of GDP by 2035, Q3 saw intensified discussions on implementation, including proposals for a “drone wall” to counter Russian activities. Italy and other members began reclassifying budgets to meet interim targets.
- Among the innovative tech stocks (MATANA*), Nvidia led the pack with an extraordinary 94% year-over-year revenue growth, driven by surging demand for AI chips and data center solutions. Tesla followed with a 30% stock surge in Q3, fueled by record deliveries despite margin pressures. Microsoft posted solid gains of 14.9%, supported by strong Azure and AI service growth.
- As of September 1, 2025, Canada lifted most counter-tariffs on U.S. goods, removing duties on billions of imports, while keeping tariffs on steel, aluminum, and automobiles. The U.S. maintained 25% tariffs on these sectors.
- Contemporaneously, concerns and uncertainties remain over the sustained military invasion of Ukraine by Russia.
- In Q3, the conflict between Israel and Hamas intensified despite earlier ceasefire efforts. A ceasefire deal was reached in early Q4.
*MATANA describes the market’s technology leaders – Microsoft, Apple, Tesla, Alphabet, Nvidia and Amazon.
This timeline was compiled by Richter Inc.’s Business Valuation and Dispute. A similar version was published in the CBV Institute’s Journal Advisory Group.
Link: https://cbvinstitute.com/wp-content/uploads/2020/11/CBV-Institute_Journal2020_Final.pdf


