





The Richter Economic Timeline: What was known or knowable and what did the market say?
Sources: Available upon request
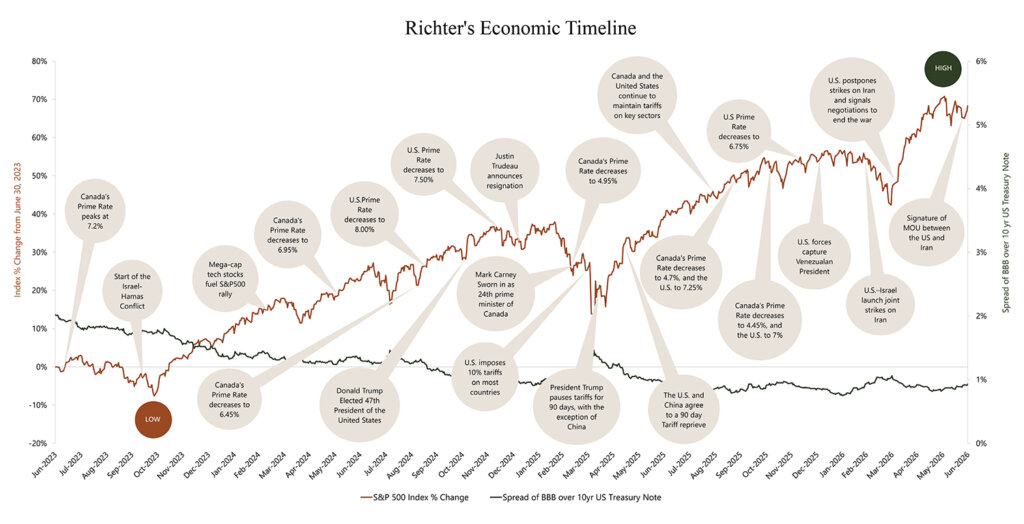
Richter’s economic timeline plots local and world events together with a depiction of the volatility of the stock market (S&P 500) and credit markets (the spread of publicly traded BBB corporate bonds over U.S. treasury notes).
Following a turbulent first quarter marked by geopolitical conflict and elevated energy prices, U.S. equities rebounded sharply in Q2 2026. The S&P 500 recovered to near-record levels, supported by renewed confidence in mega-cap stocks and AI investments, improved earnings visibility, and easing concerns surrounding the U.S.-Iran conflict towards the end of Q2. While central banks in Canada and the United States held interest rates steady amid continued economic uncertainty, declining energy prices and improving market sentiment helped support a broad-based rally in risk assets. This occurred contemporaneously with the following:
- The S&P 500 rebounded from its Q1 decline, posting one of its strongest quarterly performances since 2020 driven by improving earnings expectations, renewed enthusiasm for AI investments, and easing geopolitical tensions.
- Canada’s unemployment rate remained elevated through the quarter, fluctuating between 6.5% and 7.0%, while employment growth was largely unchanged on a year-to-date basis, reflecting continued softness in labour market conditions. Meanwhile, the U.S. unemployment rate stood at 4.2%.
- The Bank of Canada maintained its overnight rate at 2.25% throughout Q2 2026, while the U.S. Federal Reserve held the federal funds target range at 3.50% to 3.75%, as policymakers balanced persistent inflation risks against slowing economic growth and labour market softness.
- Trade policy uncertainty remained elevated throughout the quarter as the U.S. administration continued to pursue alternative tariff measures following judicial challenges to tariffs imposed under the International Emergency Economic Powers Act (IEEPA), contributing to ongoing uncertainty for businesses and financial markets. The Consumer Price Index (CPI) in Canada rose 2.8% in April year-over-year, driven largely by higher energy prices associated with the ongoing conflict in the Middle East.
- Canada’s housing market remained subdued throughout Q2 2026, as the prolonged Iran conflict continued to weigh on consumer confidence, bond yields, and mortgage affordability. Despite improving affordability relative to recent years, rising energy prices and persistent geopolitical uncertainty contributed to expectations for another flat year of housing activity.
- In late March 2026, the U.S. signaled a willingness to end the conflict with strikes on Iran postponed, and on June 17, 2026, the United States and Iran signed a Memorandum of Understanding outlining a framework for de-escalation and the gradual reopening of the Strait of Hormuz. The agreement helped alleviate concerns regarding prolonged energy supply disruptions, contributing to declining oil prices and improved market sentiment by quarter-end.
This timeline was compiled by Richter Inc.’s Business Valuation and Disputes Advisory Group. The original version was published in the CBV Institute’s Journal in 2020, and has been updated monthly or quarterly since January 1, 2020.
Link: https://cbvinstitute.com/wp-content/uploads/2020/11/CBV-Institute_Journal2020_Final.pdf