The Richter Economic Timeline: What was known or knowable and what did the market say?
Sources: Available upon request
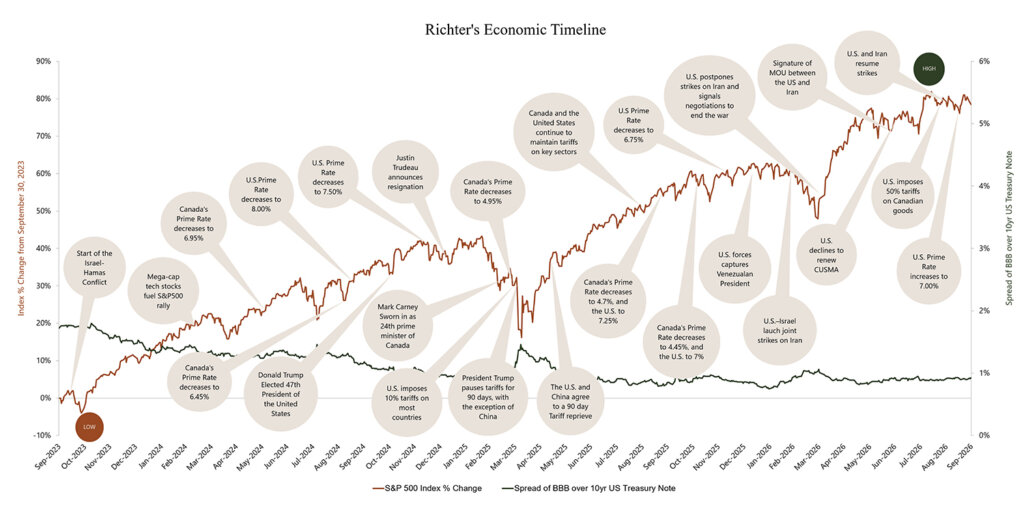
Richter’s economic timeline plots local and world events together with a depiction of the volatility of the stock market (S&P 500) and credit markets (the spread of publicly traded BBB corporate bonds over U.S. treasury notes).
Following a strong rebound in Q2, U.S. equities posted modest gains in Q3 2026. The S&P 500 reached new record highs during the quarter, supported by strong corporate earnings and AI-related investment, despite renewed hostilities in the Middle East that pushed oil prices higher and a global rise in long-term bond yields. With inflation remaining elevated, the U.S. Federal Reserve raised interest rates in September, while the Bank of Canada held its rate steady amid escalating trade tensions with the United States. This occurred contemporaneously with the following:
- The S&P 500 posted modest gains in Q3 2026, driven by strong corporate earnings and AI-related investment, although gains were concentrated in energy and a small group of large-cap technology stocks, while the majority of stocks declined.
- Canada’s unemployment rate remained elevated through the quarter, ranging between 6.4% and 6.5%, as employment declined in August and September after rising from April to July. Meanwhile, the U.S. unemployment rate stood at 4.2%.
- The Bank of Canada maintained its overnight rate at 2.25% throughout Q3 2026, while the U.S. Federal Reserve raised the federal funds target range by 25 basis points to 3.75% to 4.00% in September, its first increase since 2023, as inflation remained elevated. As a result, Canada’s prime rate remained unchanged at 4.45%, while the U.S. prime rate increased to 7.00%.
- Long-term bond yields rose globally over the quarter amid persistent inflation, higher energy prices and heavy government borrowing, with the U.S. 10-year Treasury yield ending September at 5.29%, tightening financing conditions for businesses and households.
- Trade tensions between Canada and the United States escalated during the quarter. At the July 1 joint review of the Canada-United States-Mexico Agreement (CUSMA), the U.S. declined to renew the agreement in its current form, and following the breakdown of trade talks, imposed 50% tariffs on a range of Canadian goods effective August 22, with Canada responding with matching counter-tariffs effective September 8. The Consumer Price Index (CPI) in Canada rose 3.1% in September year-over-year, driven largely by higher gasoline prices associated with the conflict in the Middle East.
- After modest gains over the summer, Canada’s housing market weakened in September, as higher oil prices pushed up bond yields and fixed mortgage rates, while concerns over a potential Bank of Canada rate hike weighed on buyer demand. Home sales declined 7.7% year-over-year in September, prompting the Canadian Real Estate Association (CREA) to revise its 2026 forecast downward for a third time this year.
- Negotiations between the United States and Iran following the June 17, 2026 Memorandum of Understanding collapsed within weeks and then expired, and direct hostilities resumed, with the U.S. striking Iran’s southern coast and Iran targeting U.S. bases across the region. With the Strait of Hormuz still contested, oil prices rebounded, adding to inflationary pressures.
This timeline was compiled by Richter Inc.’s Business Valuation and Disputes Advisory Group. The original version was published in the CBV Institute’s Journal in 2020, and has been updated monthly or quarterly since January 1, 2020.
Link: https://cbvinstitute.com/wp-content/uploads/2020/11/CBV-Institute_Journal2020_Final.pdf